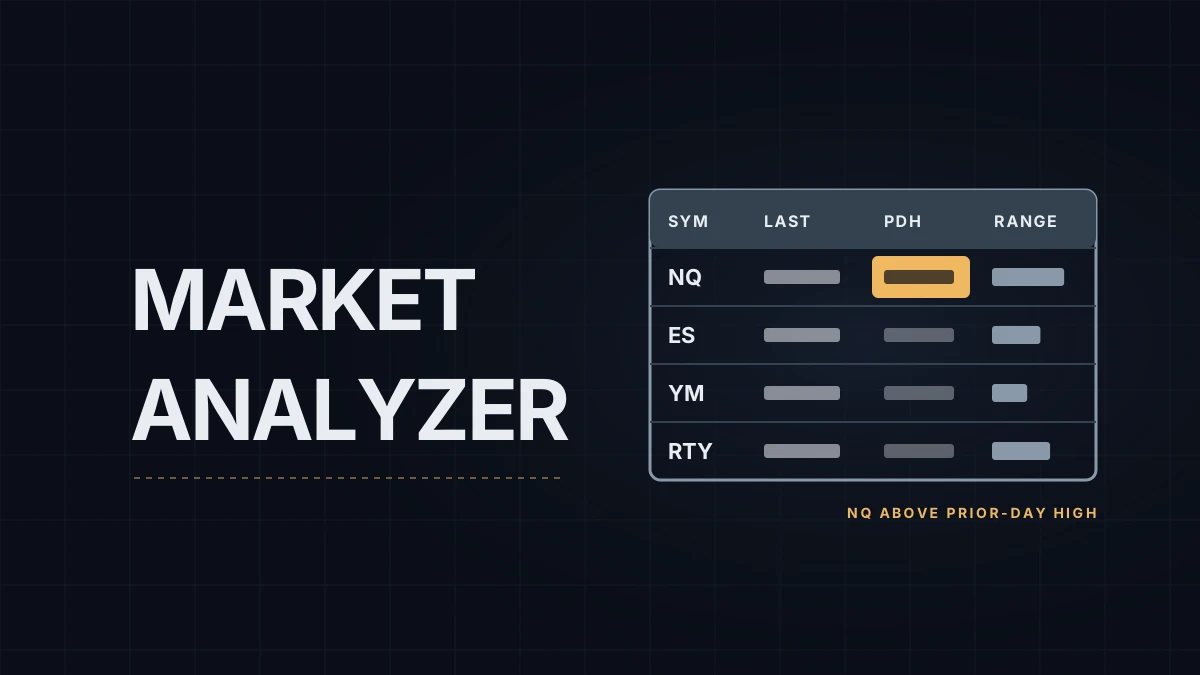
Open the Control Center, choose New › Market Analyzer, and you get an empty grid. NinjaTrader calls it a quote sheet that can scan many instruments with custom criteria; most traders use it as a list of prices and never add a second column. Four rows and a handful of columns turn it into a pre-session dashboard for the index futures: where each one trades, how far it has moved, where yesterday's levels are, and how big a normal day is. It lives next to the charts set up in the NinjaTrader 8 chart setup guide, not instead of them.
Rows: the four index futures
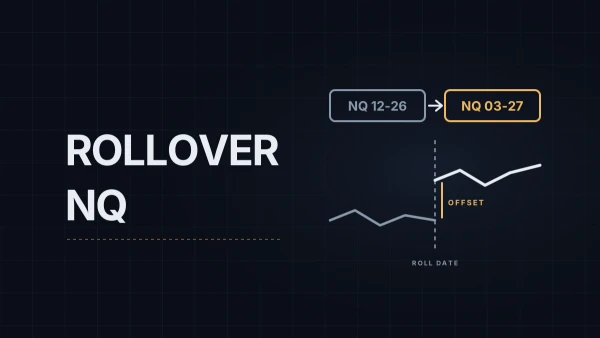
Add NQ, ES, YM and RTY in the current contract month (NQ 12-26 until the December roll, then 03-27; the NQ rollover post covers the switch). Even if you trade only NQ, the other three tell you whether a move is the whole market or just tech. Right-click the grid to add rows one by one, or add a saved instrument list if you keep one.
Columns: price data first
Add the market data columns from the column list in the right-click menu: last price, net change for the session, the day's high and low, and volume. Check the names on your build; the help guide describes the grid but your column list is the authority. Net change is the column that does the most work: four numbers side by side show at a glance whether NQ is leading or lagging the rest.
Indicator columns: levels and range
Any indicator, including your own, can be a column. The settings come in four groups:
| Group | Setting | What to choose here |
|---|---|---|
| Indicator | Indicator and Plot | Which indicator, and which of its lines |
| Data Series | Input series, Price based on, Type, Value | The bars the indicator runs on: Close, Last, and the bar type and size |
| Time Frame | Load data based on, Bars to load, Trading hours, Break at EOD | How much history to load and which session template to use |
| Set up | Calculate, Maximum bars look back | How often it updates and how much memory it keeps |
Three columns earn their place for a level trader:
- Prior day high and low. The built-in PriorDayOHLC indicator has separate plots for the prior high and low. Add it twice, once per plot, on any intraday series with your regular-hours template, and the two numbers sit next to the last price. The template decides which "prior day" you get, which is why the trading hours template guide matters here.
- Daily ATR. ATR(14) on daily bars gives the size of a typical day, the number the average daily range post uses. Set the column type to Bar graph and the cell fills in proportion to the value, up to the column's maximum display value. In raw points the four markets aren't comparable, since the indices are priced on very different scales, so read each bar against its own recent days. Text-based columns have to stay Regular; a text column set to bar graph shows blank.
- Your own levels. If you mark session levels with an indicator that exposes them as plots, those plots can be columns too. The tool in the session levels post only draws, so it can't.
Conditions: color and filter
Two kinds of conditions turn numbers into signals. A cell condition changes a cell's color or text when its value passes a number you set, for example the net change cell turning green above +1% and red below −1%. It compares the cell with a fixed value, not with another column, so "last price above the prior day high" needs a small custom indicator that outputs a signal value, with the condition set on that column. A filter condition hides rows that don't meet a rule, which matters more with a list of fifty stocks than with four futures. Keep the colors few. A grid where every cell is colored says nothing.
Link it to the chart
Give the Market Analyzer and a context chart the same instrument link color, and clicking a row switches that chart to the market. Keep the execution chart on a color of its own, as the workspaces and instrument linking post explains, so a click can't drag it to another instrument. For an NQ trader this makes the watchlist a quick check: click ES, look at its structure, click back.
Keep it light
Indicator columns calculate on live data for every row, so they cost CPU in the same way chart indicators do.
- Calculate: On price change updates when price moves without processing every tick. On each tick is rarely needed in a watchlist. On bar close is the lightest, though a column on daily bars then won't update until the day closes.
- Maximum bars look back: the help guide says the 256 setting, the default, uses the least memory, and none of the columns above need more.
- Bars to load: an ATR(14) needs about 20 daily bars, not a year of history.
If the platform already feels slow, the NinjaTrader performance post covers where the load usually comes from, and a Market Analyzer with dozens of tick-based indicator columns is a common one.
Educational content, not investment advice. Futures trading involves substantial risk of loss. Examples are for illustration only. Read the full Risk Disclosure.