Weekly and Monthly Levels on NQ: Prior Week High and Low, the Weekly Open and When They Matter
Prior day high and low get redrawn every morning. The prior week's high and low, the weekly open and last month's range change far less often, and that's what gives them weight. Which levels to draw, why your session template changes them, and when they matter more than the daily ones.
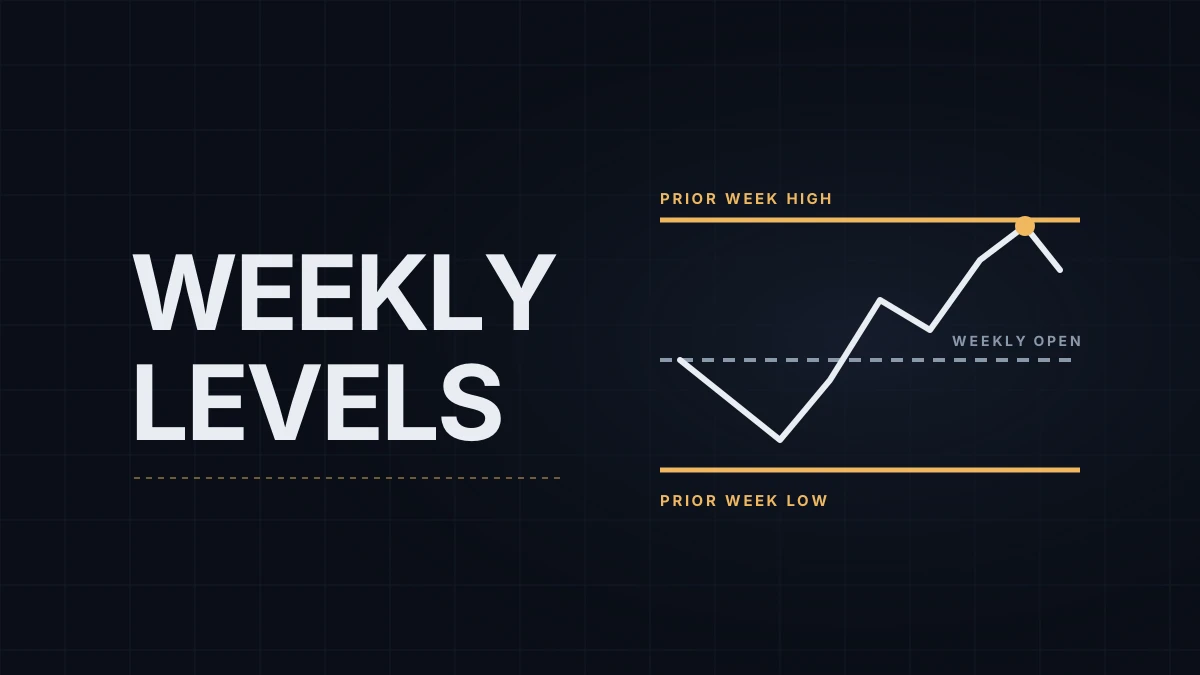
Weekly levels are the reference prices one timeframe above the daily ones: the prior week's high and low (PWH and PWL), the prior week's close, and the price where the current week opened. Monthly levels are the same idea one step higher. They sit next to the prior day high and low from the key levels guide, and they change less often, which is the reason traders bother with them. A level that has held for a whole week was seen and acted on by more participants than one set yesterday afternoon.
All of them are measured in index points like any other level; the NQ vs MNQ guide translates points into dollars per contract.
The levels worth drawing
- Prior week high and low. The extremes of the last completed week. The most-watched pair after the daily ones.
- Prior week close. The last price of Friday's session. Monday's open is measured against it, so it works as a weekly gap reference.
- Weekly open. The first trade of the week, Sunday 6:00 PM ET on Globex (midnight in Central Europe in winter). Price above it means the week is up so far, below means down. Simple, and many traders keep it on screen for that reason alone.
- Prior month high and low, and the monthly open. Fewer touches, more weight when they come. Most useful in the first week of a new month, when last month's range is the nearest frame.
Five or six lines is enough. Each one you add makes the others harder to see, which is the opposite of what a level is for.
Whose week? The template question
A week's high depends on which hours count. On a chart with the full Globex session, the weekly high includes the overnight hours, so a spike at 3 AM ET on Wednesday can be the week's high. On a chart limited to the cash session (9:30 AM to 4:00 PM ET) that spike doesn't exist, and the weekly high is lower. Both are legitimate. What matters is that you know which one you drew, and that it matches what you trade. The trading hours template guide shows how NT8 decides which bars belong to which session, and the overnight session post covers why overnight highs and lows behave differently.
Drawing them in NinjaTrader 8
NT8's built-in Prior Day OHLC indicator covers the daily levels only. For weekly and monthly ones:
- Open a 60-minute NQ chart with the trading hours template you trade on, loaded far enough back to show two full weeks (or two months for monthly levels).
- Read last week's high, low and close off the bars, and the first bar of the current week for the open.
- Draw a horizontal line at each one and label it (PWH, PWL, WO). The drawing tools guide covers the line tools and how to attach an alert to a line.
- Keep the lines in the saved workspace (or set them to All charts), or redraw them each Monday. Five minutes once a week.
A weekly bar chart looks like a shortcut, but NT8 builds daily and longer bars on the data provider's session, not on your trading hours template, so check it before you trust it. Compare its high with the high on the 60-minute chart. If they don't match, the weekly bar is using a different session than you are. Indicators from the NinjaTrader ecosystem can plot these levels automatically, and the session levels post covers a similar setup for the daily session.
When the weekly level outranks the daily one
Most days the weekly levels sit far away and do nothing. They earn screen space in three situations.
When price trades close to them. Say NQ opens Monday 150 points below last week's high, and Friday's high sits 30 points below that. The prior day high is the nearer reference, but a break through it runs straight into a level the whole market drew over the weekend. Many traders treat the second level as the more likely place for a reaction, and plan the trade's target or exit around it.
When daily and weekly levels coincide. A prior day low that sits within a few points of the prior week low is one zone, not two lines, and usually draws more orders than either level alone would.
When the market breaks out of a multi-day range. A week that spends four days inside the prior week's range and then breaks PWH has changed character. Whether the break holds into the close often tells you more than any intraday signal that day, and it connects to the range-versus-trend question in the opening range guide.
None of these are signals. They tell you which level to watch harder.
Educational content, not investment advice. Futures trading involves substantial risk of loss. Examples are for illustration only. Read the full Risk Disclosure.