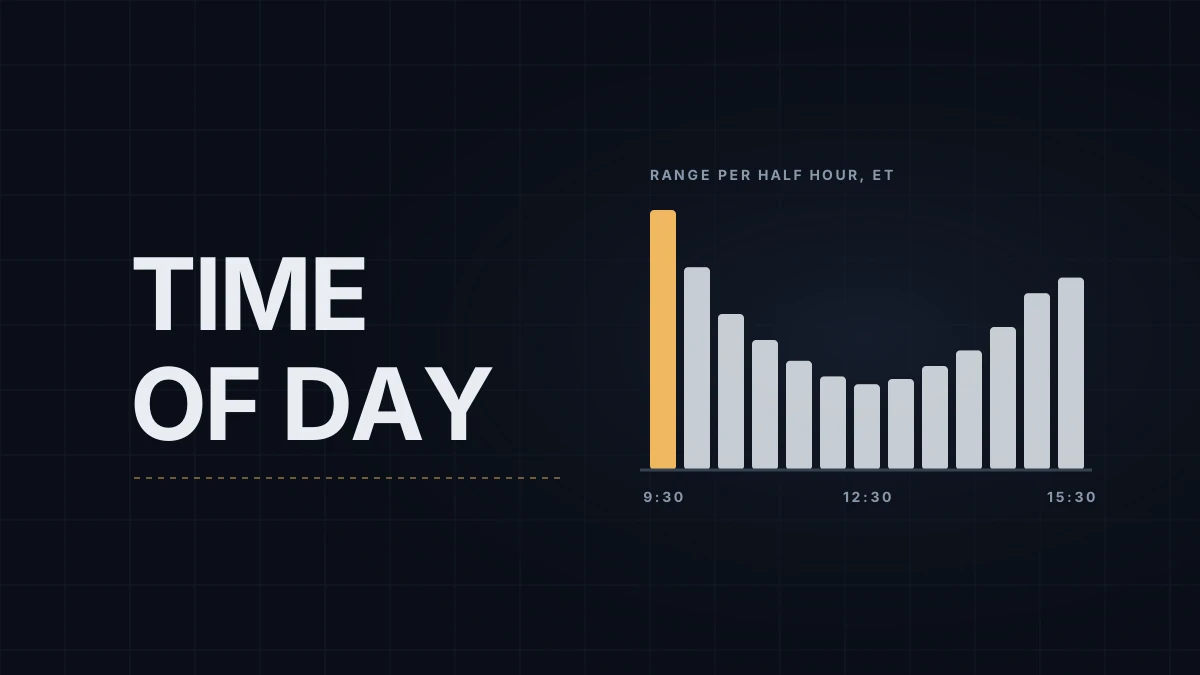
Volatility on US index futures isn't spread evenly through the day. It bursts at the open, fades to a low around midday, and rises again into the close. Researchers have described this U-shape for decades: Wood, McInish and Ord measured it in US stocks in 1985, and in 1995 Chang, Jain and Locke showed that S&P 500 futures volatility drops when the NYSE closes and picks up again into the futures close 15 minutes later. Later work keeps finding it, with the open the taller side of the U.
On NQ the shape costs real money. At $20 per point (the arithmetic is in the NQ vs MNQ tick and point value guide), a 30-point five-minute bar after the open is $600 on one contract, and the same five minutes at lunch might cover a third of that.
NQ's day, window by window
Times in ET and CET. The European column holds all year, as CEST in summer, except for the two short periods each year when the US and Europe change clocks on different dates, which the daylight saving post covers.
| ET | CET | What happens | Typical activity |
|---|---|---|---|
| 6:00 PM to 3:00 AM | 00:00 to 09:00 | Globex reopens, Asia trades | Low, moves on headlines |
| 3:00 to 8:30 AM | 09:00 to 14:30 | European open and morning | Picks up at the European open, moderate |
| 8:30 AM | 14:30 | US data: CPI, payrolls, jobless claims | Spikes on release days |
| 9:30 to 10:30 AM | 15:30 to 16:30 | Cash open and the initial balance | Highest of the day on most days |
| 10:00 AM | 16:00 | Second data slot: ISM, JOLTS, sentiment | Spikes on release days |
| 11:30 AM to 1:30 PM | 17:30 to 19:30 | Europe closes, US lunch | Lowest of the regular session |
| 1:00 PM / 2:00 PM | 19:00 / 20:00 | Treasury note and bond auctions / FOMC on meeting days | Event-driven |
| 3:00 to 4:00 PM | 21:00 to 22:00 | Last hour, cash close, settlement | Rises again |
| 4:00 to 5:00 PM | 22:00 to 23:00 | After the cash close, earnings releases | Spikes on earnings nights |
| 5:00 to 6:00 PM | 23:00 to 00:00 | Daily maintenance break | No trading |
The overnight rows are covered in more depth in the NQ overnight session post, and the full session map in NQ trading hours.
Why the day has this shape
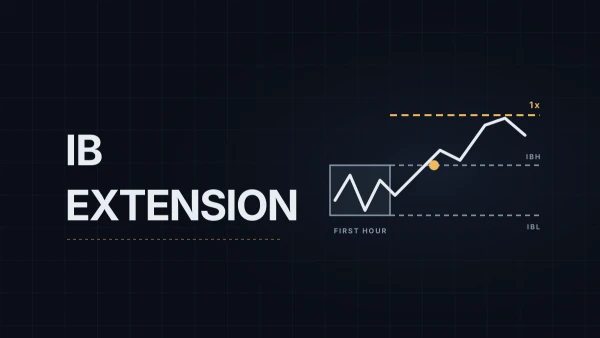
The explanations usually given are about who is at the desk. At the open, everything that happened overnight gets priced at once: cash equities start trading, opening orders hit, and options dealers adjust hedges. The first hour sets the initial balance, which the opening range and initial balance post treats as a reference for the rest of the day. By late morning European desks are closing their day and US traders are at lunch, so fewer participants trade smaller size. Into the close the activity returns: index funds and other investors who trade at the closing price, positions squared before the overnight session, and the daily settlement just before 4:00 PM ET, described in the settlement price post.
Scheduled events cut across all of it. A CPI morning or an FOMC afternoon can make a normally quiet hour the busiest of the week, which is why the high-impact news post matters more than any average profile.
What it changes in a plan
The same stop means different things in different windows. A 20-point stop at 9:35 AM ET can be inside one five-minute bar's range. At 12:30 PM the same stop may sit untouched for an hour while the trade goes nowhere. Traders handle this in a few ways, each with a cost:
- Trade one window only. Many intraday traders trade the first 90 minutes and stop. It concentrates attention where the movement is, and skips everything else, including good afternoon setups.
- Scale the stop to the window. A wider stop and smaller size in the opening hour, tighter in the afternoon. It keeps the dollar risk constant, but the stop distance has to come from structure, not just the clock, and the average daily range post shows one way to anchor it.
- Wait for the initial balance. Some traders skip 9:30 to 10:30 entirely and trade the break or rejection of the first hour's range. They miss the open's moves in exchange for a defined reference.
I trade two blocks, 7:00 to 9:00 and about 12:00 to 16:00 CET, and stay flat into the 8:30 AM ET releases, so most of my hours fall in the quiet and moderate rows of the table. The trading NQ from Europe post goes through how that day is built.
Measuring it on your own chart
Averages from studies describe the market over years. Your own numbers describe the period you trade:
- Load 30-minute NQ bars with the full electronic session in NinjaTrader or TradingView for the last 60 sessions.
- For each bar, compute the range (high minus low) and average it by time of day.
- Do it twice, once with data days (CPI, payrolls, FOMC) and once without, and compare the two profiles with the average daily range.
The result is a table of what a typical half hour costs in each window, which is the number to size a stop against.
Educational content, not investment advice. Futures trading involves substantial risk of loss. Examples are for illustration only. Read the full Risk Disclosure.