A daily review looks at charts, the way the price chart guide teaches you to read them. A yearly review looks at the numbers behind those charts, and a year of trades is the biggest sample most discretionary traders ever get. Two hundred or four hundred trades can answer questions that a week, or even a month, can't, as the sample size post explains. The review below runs in four passes and takes an afternoon if the journal is in order.
Pass 1: the numbers, after every cost
Export the year's trades (the NinjaTrader trade export guide covers getting them out) and calculate:
- Net result after all costs. Commissions and exchange fees, data, platform, and for prop traders every evaluation, reset and activation fee paid during the year. The cost to first payout post lists what belongs here. Many traders who were profitable on trades were not profitable on the year.
- Expectancy in R. Average result per trade divided by average risk, the measure described in the expectancy and risk of ruin post. It compares months with different position sizes.
- Maximum drawdown, in dollars and in R, and how long the recovery took.
- Win rate and the average win and loss, which explain the expectancy rather than replace it.
Pass 2: split it until it says something
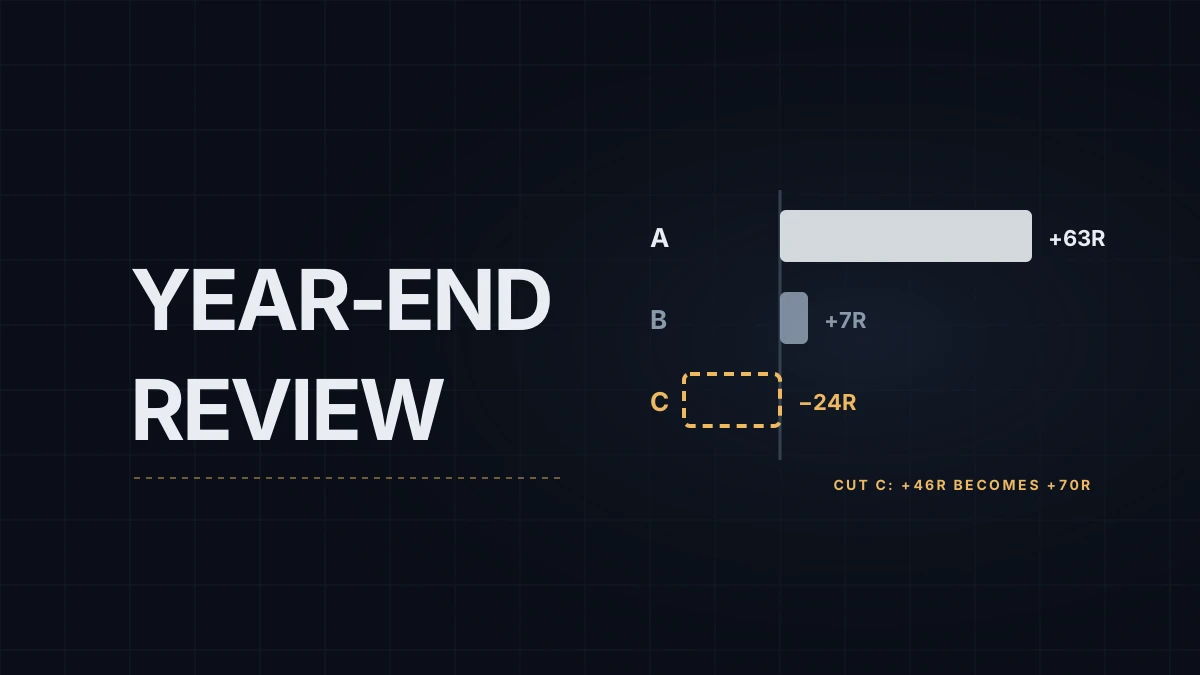
The total hides the mix. Split the same numbers by setup, by grade, by time of day and by day of the week. A hypothetical year of 400 trades shows why:
| Group | Trades | Expectancy | Total |
|---|---|---|---|
| Setup A | 180 | +0.35R | +63R |
| Setup B | 140 | +0.05R | +7R |
| Setup C | 80 | −0.30R | −24R |
| Year | 400 | +0.115R | +46R |
Without setup C, the same trader makes +70R on 320 trades, more than half again as much with less screen time. Setup B is the harder call: +7R over 140 trades is close to zero, and at that sample size it may be nothing. If you grade trades as they happen, using a scheme like the one in the trade setup grading post, split by grade the same way. The A-to-C game analysis covers what the split says about your execution on good and bad days.
Be careful with small buckets. Eighty trades are enough to suspect a setup; twelve Friday afternoons are not enough to ban Fridays.
Pass 3: reread the extremes
Pull the ten worst days and the ten best days and reread the journal entries for them, not the P&L. What did the worst days have in common: a news event traded through, a size increase, a rule broken after the first loss, a short night? What did the best days share? Count the rule breaks for the year, and if you log skipped signals as the missed trades journal post suggests, check whether your skips helped or cost you.
This pass usually finds the one behavior that cost the most. It is rarely a missing indicator.
Pass 4: change three rules at most
Write the changes into next year's plan, using the structure of the trading plan template. Three rules at most, each tied to a number from the passes above: "drop setup C," "no trades in the 15 minutes after the 8:30 AM ET release," "size stays fixed for the first two weeks of any new account." More than three changes at once and next year's results can't tell you which one worked.
Then write down what would tell you a change failed, and when you'll check. A change you never measure is a guess you made in December.
Educational content, not investment advice. Futures trading involves substantial risk of loss. Examples are for illustration only. Read the full Risk Disclosure.