
All posts
Market notes, session journals, weekly reviews and everything in between, newest first.
Newest first
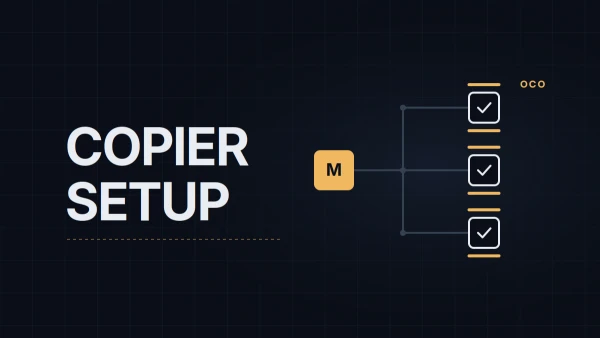
- Trade Copier Setup in NinjaTrader 8: Master, Followers, Brackets and Contract Ratios Two ways a copier can close a follower, and only one of them survives a crash. Installing a copier add-on in NinjaTrader 8, picking the master and followers, what happens at entry, at a stop move and at exit, how to read the sync column, and why a 1:1 quantity rule is a feature.
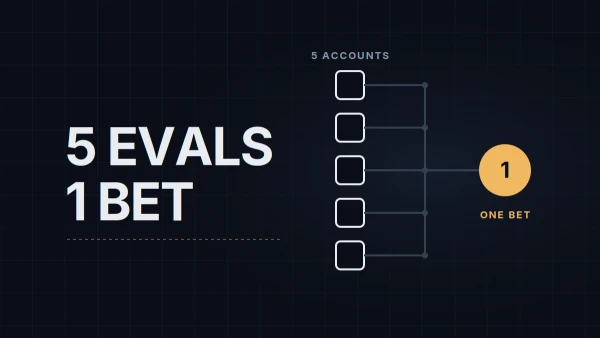
- Trading Multiple Evaluations at Once: Diversification or Correlated Risk? The Math Five copies of the same trade are one bet with five tickets, not five bets. What running several evaluations at once changes and what it doesn't: pass probability, drawdown per contract, the payout cap, the fee bill, and the one version of "multiple accounts" that diversifies anything.
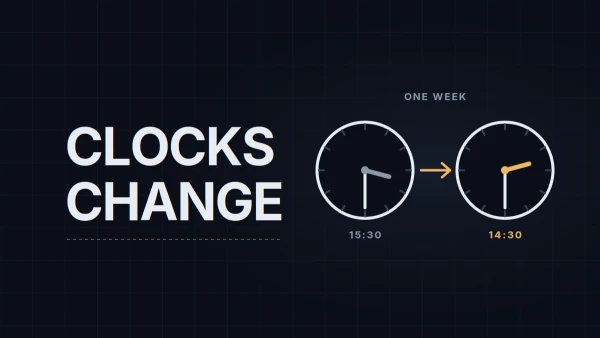
- US and EU Clocks Change on Different Dates: NQ Session Times from October 25 to November 1 (and Every Spring and Fall) CME never changes its clock, so US traders see nothing move. Everyone else does, twice a year, and for one week each fall and two or three each spring the US and European clocks are out of step. The NQ session table for that week, the spring version, and what to check in NinjaTrader.
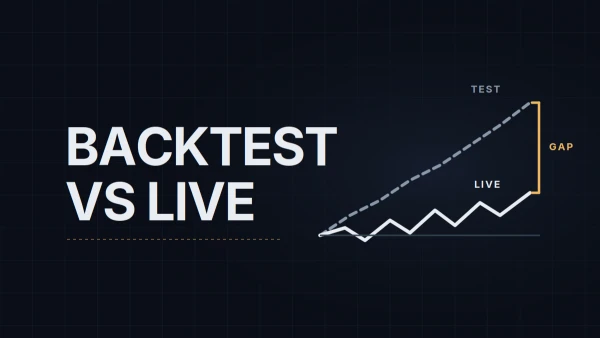
- Backtest vs Live Results: Why the Gap Exists and How to Discount It A rule that won 62% of 400 replayed trades wins 51% of the first 40 live ones. Where the difference comes from, which sources hurt and which only add noise, and a way to haircut a backtest before it gets a single contract of real money.
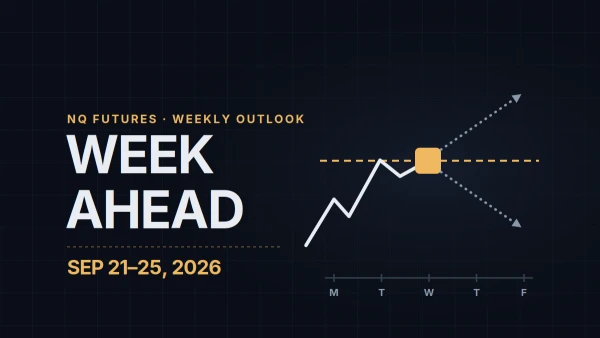
- NQ Week Ahead (Sep 21–25, 2026): Flash PMI, Costco, Xi in Washington and a 10-Year at 5% The Fed hiked, NQ printed a lower low at 29,053 and closed the week back at the prior value area high. This week has no tier-1 release, so the 10-year yield, Wednesday's flash PMI and Thursday's Xi visit decide whether last week's failed breakdown gets resolved.
- How to Record Trading Sessions: Why Video Beats Screenshots, and an OBS or Camtasia Setup A screenshot shows where price went; a recording shows what you saw when you clicked. Setting up OBS Studio or Camtasia for a trading desk, the hotkey mistake that can place an order, what six hours of charts cost in disk space, and how to land on one trade in a long file.
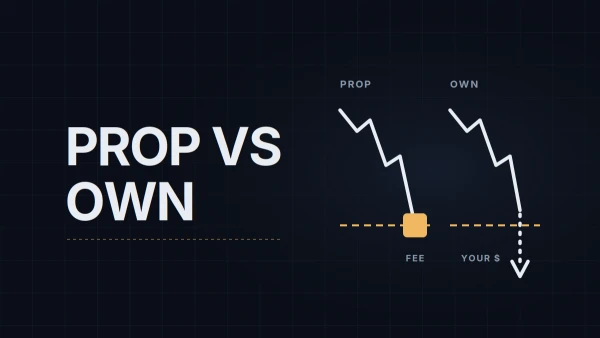
- Prop Firm vs Personal Account: Cost, Leverage, Rules and Where the Risk Sits The same MNQ contract, two very different deals. What a prop evaluation and a personal brokerage account cost, why the leverage looks identical until price gaps through a limit, the break-even between fees and your own drawdown, and the tax difference most traders learn about last.
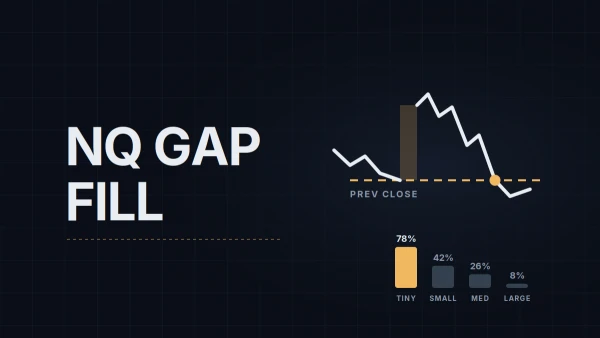
- NQ Gap Fill: Overnight Gaps, Fill Rates by Gap Size and What the Statistics Leave Out Three in five NQ opening gaps close the same day, and the average hides almost everything. Fill rates by gap size, how fast fills happen, which contexts move the odds, what a fade costs on one micro, and why the previous close depends on your platform.
- Trading Plan Template: One Page for Pre-Session, Live and Ending, and Why No Trade Is a Valid Outcome A plan you can't read in the minutes before the open doesn't get read. A copyable one-page template split into pre-session, live and ending blocks, two other shapes a plan can take and what each costs, and the arithmetic behind counting a no-trade day as a result.
- Bookmap Setup for NQ: Heatmap Settings, Volume Dots and What to Turn Off A dark heatmap and a blinding one have the same cause: two cutoff values. Setting them for NQ, filtering volume dots so absorption is readable, which columns earn their width, loading your levels as notes with alerts, and the panels and add-ons worth switching off.
- Prop Firm Prohibited Trading Practices: Cross-Account Hedging, News Rules, DCA and Why the Rules Exist Most prop firm bans trace back to one fact: the fills are simulated. The practices Lucid, Topstep and Apex prohibit, grouped by the reason behind each, where their news rules part ways, and why averaging down is allowed while the way it usually ends is not.
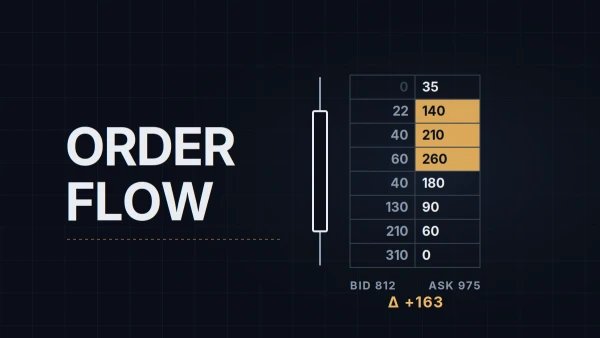
- Order Flow Basics: What Delta, Absorption and Imbalance Mean and Where They Mislead A trade prints at the ask when the buyer was in a hurry and at the bid when the seller was. Delta, footprint imbalances and absorption are three ways of counting that, and all three are silent about the side that decides. What the numbers mean on NQ, one footprint bar read cell by cell, four lies.
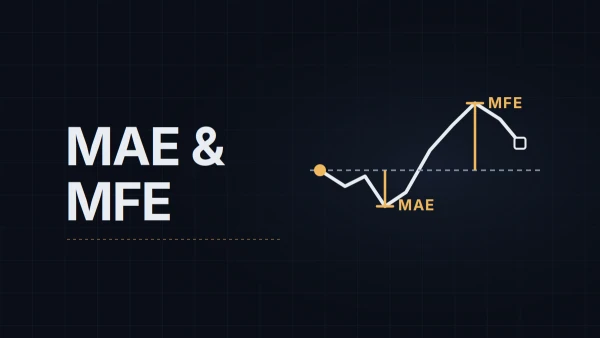
- MAE and MFE Explained: What Excursion Data Says About Your Stops and Targets Every closed trade leaves three numbers behind; the account keeps one. Maximum adverse and favorable excursion, read on a 40-trade sample: which side of each histogram says something about the stop and the target, the cost of moving either, how to collect the numbers, and four ways they mislead.
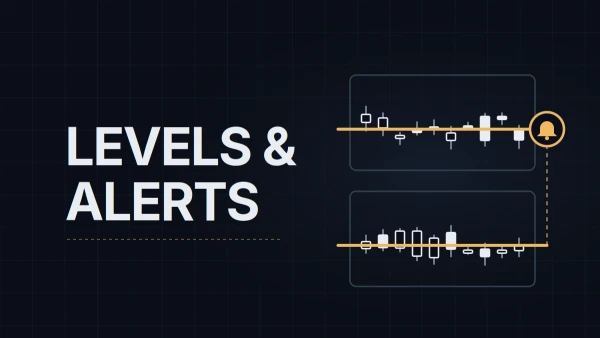
- Drawing Tools and Alerts in NinjaTrader 8: Levels That Persist Across Charts and Sessions Draw PDH on the 15-minute chart and it isn't on the range chart. One setting fixes that, one window fixes every line at once, one dialog hangs a sound on the level. What Attach to does, which four tools mark levels, how to build an alert that fires more than once, and why nothing fires at night.
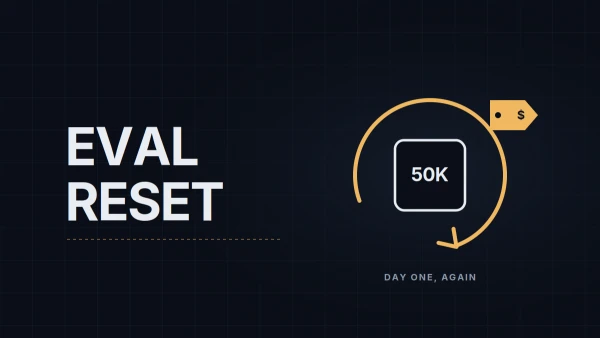
- Resetting an Evaluation: The Math of a Reset vs a New Account, and When It's Tilt Every breach ends on the same screen: a reset button and a price. The decision has two parts and traders usually get the order wrong. First the arithmetic, which ignores how close you were; then the diagnosis, which decides whether you should be buying anything today at all.
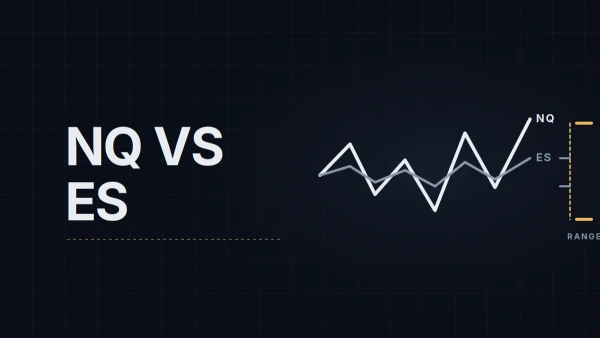
- NQ vs ES: Correlation, Beta and Which Index to Trade The $50 point makes ES look like the bigger contract; the daily range makes NQ the bigger bet. How the two E-minis compare once points become dollars, why a 0.9 correlation means holding both is one position, where their intraday behavior differs, and the three answers to "which one".
- Trading Journal Basics: What to Record, What to Ignore and Why Screenshots Beat Numbers A broker statement records fills. A journal records decisions, and decisions are the only thing you can change. The eleven fields worth logging on every trade and every no-trade day, the numbers that mislead when they become the headline, and the case for a screenshot at entry over a row of prices.
- TradingView vs NinjaTrader for Futures: Charting, Execution and What Each Costs One is a browser tab that charts everything and executes through a broker panel; the other is a Windows program that executes everything and charts what you feed it. Where each wins on bars, orders, replay, add-ons and data, what the monthly bill is, and why many NQ traders run both.
- Evaluation vs Instant Funding vs Live Accounts: Three Prop Firm Models Compared Every futures prop firm sells the same thing three ways: pass a test first, pay more and skip the test, or earn a live account. The cost of each route, the rules attached to it, the pass rate at which paying to skip the evaluation stops being expensive, and who tends to pick which.
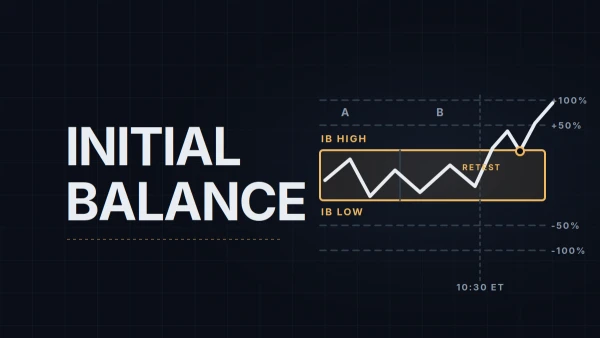
- Opening Range and Initial Balance on NQ: How They're Defined and How Traders Use Them The first hour of RTH draws a box that the rest of the day trades against. What the opening range and the initial balance measure, why the width of the box matters more than its direction, what 5,500 sessions of ES and NQ data say about breakouts, and the two ways traders use the levels.
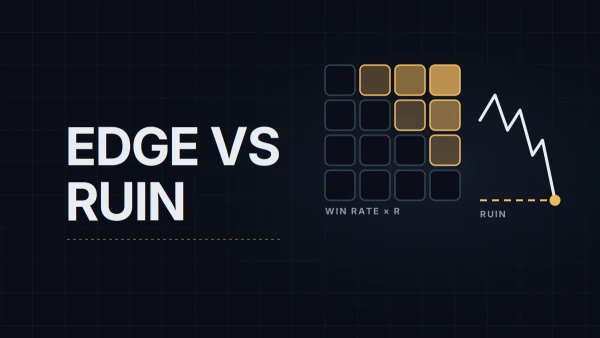
- Expectancy and Risk of Ruin: The Two Formulas Behind Every Sizing Rule Expectancy says whether a method makes money per trade. Risk of ruin says whether you survive long enough to collect. Both formulas, one grid of win rate against payoff, and the size at which an edge stops mattering.
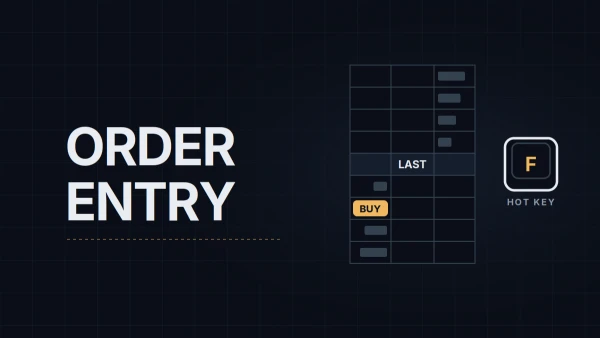
- Order Entry in NinjaTrader 8: Chart Trader, SuperDOM and Hot Keys Chart Trader, SuperDOM or hot keys: which one for which order, how to set each up, and the five ways an order goes to the wrong price, the wrong window or the wrong account.
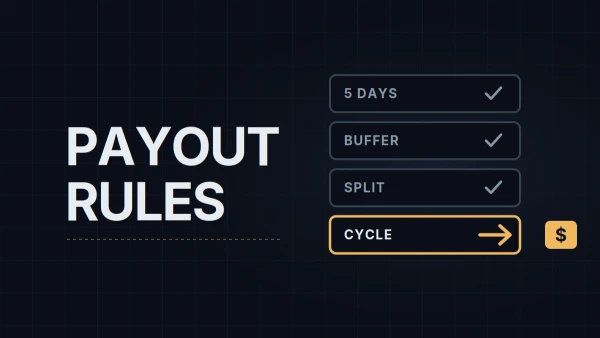
- Prop Firm Payout Rules Explained: Minimum Days, Buffers, Profit Splits and Cycles Passing the evaluation opens the account; four more layers decide what leaves it. Qualifying days, buffers, splits and per-request caps, and why the same $3,000 of profit on a 50K account pays $900 at one firm and $1,350 at another.
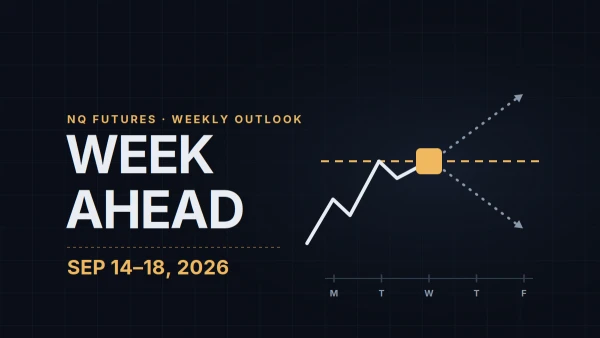
- NQ Week Ahead (Sep 14–18, 2026): FOMC, the Dot Plot and Quarterly Expiration Four weeks in a range under 900 points wide, moving averages stacked, and a Fed hike about 90% priced for Wednesday. Where last week's map held, the levels I've marked on December, and how the European session lines up around FOMC and Friday's expiration.
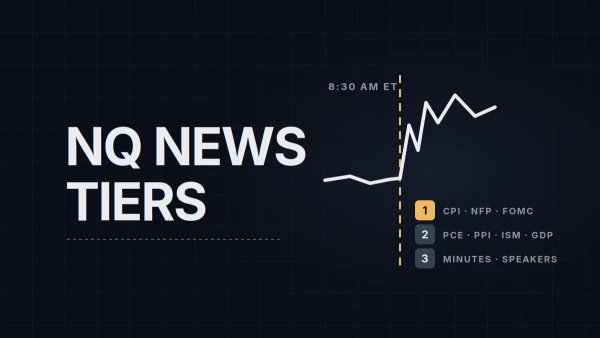
- Economic Releases That Move NQ: CPI, NFP, FOMC, ISM and the Rest, Ranked by Tier Three releases decide most of the big data days on NQ, a dozen more move it when the number surprises, and the rest fill calendars without moving the contract. The full tier list with ET and CEST times, the NQ-specific events macro calendars miss, and the Q4 2026 dates.
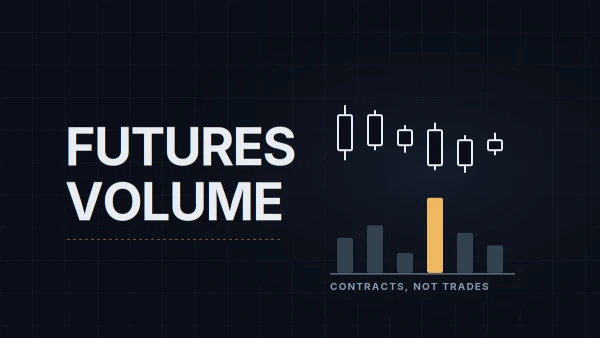
- Volume in Futures Explained: What It Measures, Why It's Cleaner Than Stock Volume and What It Can't Tell You One print of 50 contracts is 50 volume and one tick. Why that distinction matters in futures, why NQ volume is cleaner than any stock's, what open interest adds, and four situations (roll week, time of day, news, data feeds) where the histogram lies.
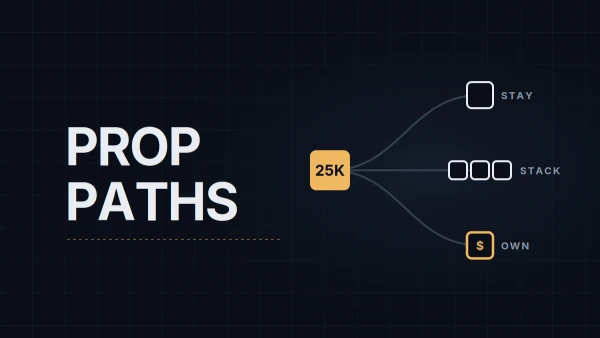
- Prop Trading Long Term: Staying Funded, Stacking Accounts or Moving to Personal Capital After the first payout the question changes from "can I pass" to "what is this for". Three paths traders take from a funded account: stay funded, stack accounts, move to personal capital, each with the cost the marketing page leaves out.
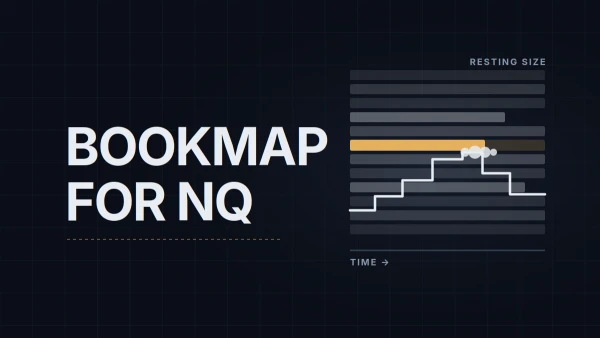
- Bookmap for NQ: What a Heatmap Shows That a Chart Doesn't (and What It Doesn't) A price chart records trades. A heatmap records the orders that were waiting, the ones that got pulled, and the ones that absorbed 400 contracts without moving price. What Bookmap adds to an NQ level, where it misleads, and what a full-depth setup costs at the time of writing.
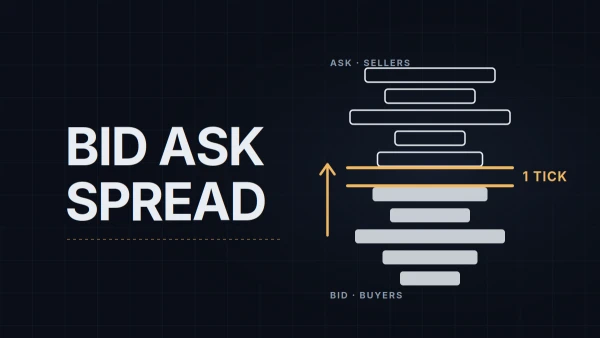
- Bid, Ask, Spread, Liquidity and Slippage: What Happens When You Hit the Button Click buy at market and you are down one tick before anything happens. Not a loss on price, a payment for certainty. Where the bid and ask come from, what depth means, why a market order sometimes fills three ticks away, and the three ways traders handle the bill.
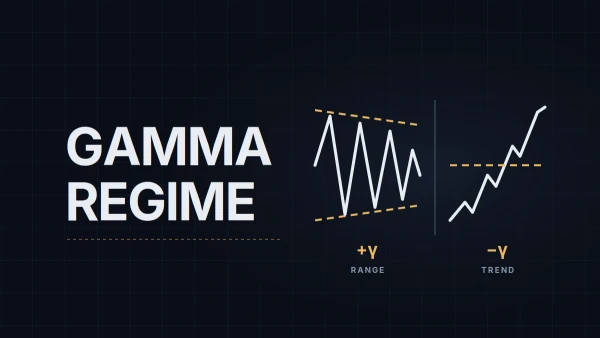
- Positive vs Negative Gamma on NQ: What Dealer Hedging Does to Intraday Behavior The same 40-point drop into a level bounces on one day and runs 150 on the next, and often the difference is a hedging flow nobody on the chart can see. How dealer gamma works, what positive and negative regimes look like on NQ, where the GEX number comes from, and how far to trust it.
No posts in this hub on this page yet.
On YouTube
Session recordings with commentary are coming to the channel. Subscribe to catch the first one.
Subscribe on YouTube