NQ Fell 7% and Never Halted: The November 5, 2026 Chip Crash Explained
News Nov 5, 2026

NQ Fell 7% and Never Halted: The November 5, 2026 Chip Crash Explained

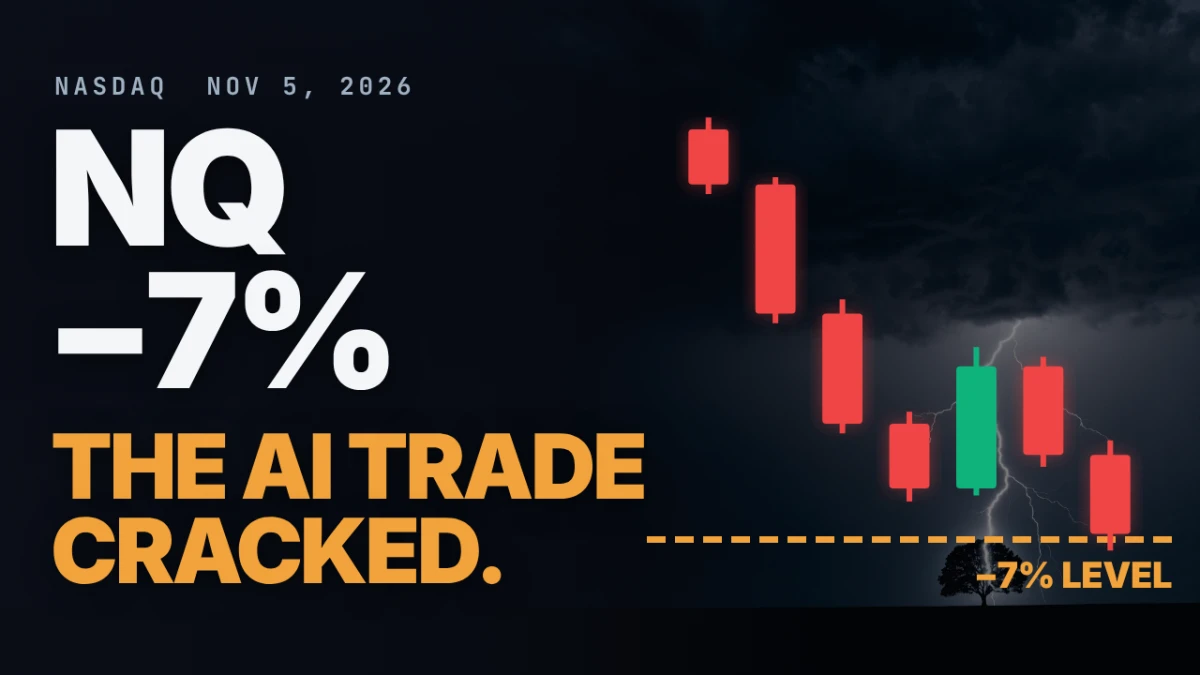
The chip index had its worst day since March 2020, the Nasdaq-100 closed down 6.4%, and NQ traded through its own 7% level after the stock market closed. What drove the selloff, why no limit triggered, and what a 1,900-point range does to position size.

Read the full post →
Education Oct 9, 2026

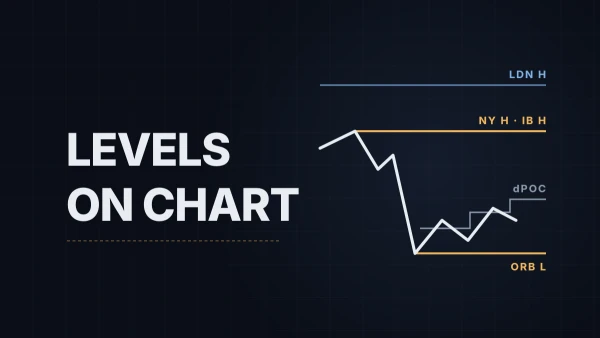
Session Levels on the NinjaTrader Chart: Setting Up WotT Session Key Levels

London high and low, the opening range, the initial balance, yesterday's value area: the same handful of prices goes onto the chart every morning. WotT Session Key Levels draws them on a NinjaTrader 8 chart: installing it, the settings that matter, three setups, and what it deliberately doesn't do.

Education Oct 8, 2026

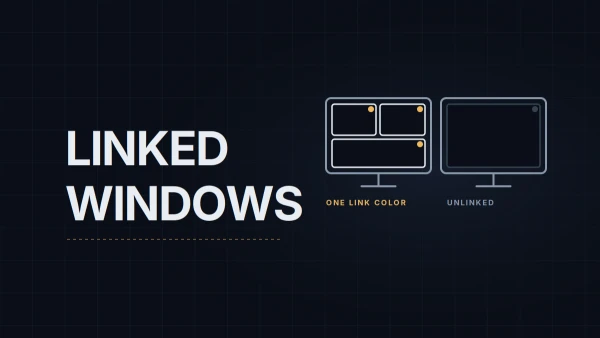
Workspaces, Instrument Links and Multi-Monitor Layouts in NinjaTrader 8

One chart turns into a desk quickly: an execution chart, a context chart, Time and Sales, a second monitor. How NinjaTrader 8 keeps those windows on the same instrument, how workspaces save and switch whole layouts, what tabs are good for, and what to do when a monitor goes missing.

Education Oct 8, 2026

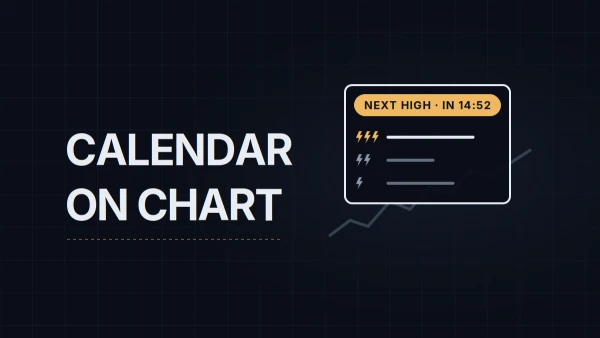
Economic Calendar on the NinjaTrader Chart: Setting Up WotT Event Monitor

An economic calendar in a browser tab is one more window to check. WotT Event Monitor draws this week's USD releases and Nasdaq earnings on the NinjaTrader 8 chart: installing it, the settings that matter, three setups for three kinds of trader, and what it deliberately doesn't do.

Education Oct 7, 2026

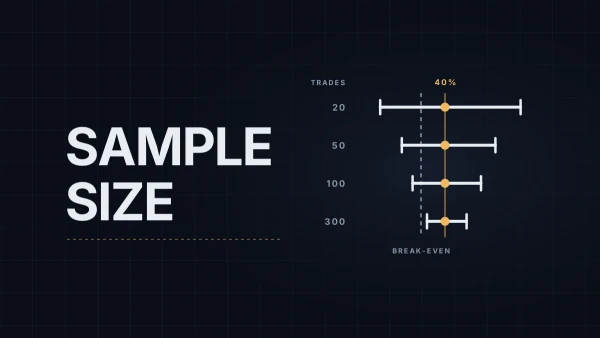
How Many Trades Before You Judge a Setup? Sample Size for Traders

What 20, 50, 100 and 300 trades can and can't tell you about a setup, with the ranges computed: how often a real edge shows a losing record, how often no edge looks good, a rule of thumb for the count you need, why trailing exits need more, and what to do while the sample is small.

Education Oct 6, 2026

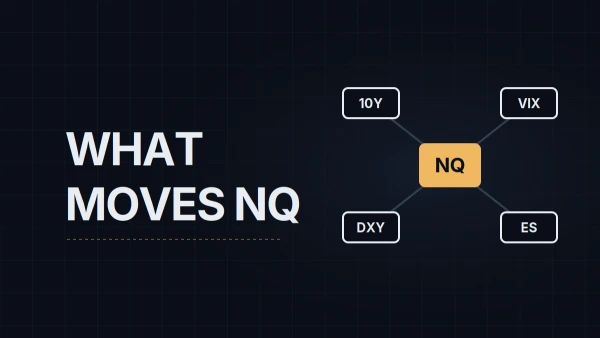
What Moves Nasdaq Futures: Yields, VIX, the Dollar and the NQ/ES Ratio

Yields, volatility and the dollar each move Nasdaq futures through a mechanism you can name, and each link has conditions under which it breaks; the NQ/ES ratio shows which index leads. The discounting arithmetic, what 2022 showed, what Nasdaq's research found, and how to use the four as context.

Education Oct 5, 2026

Moving Averages: What They Measure and Why Most Settings Are Arbitrary

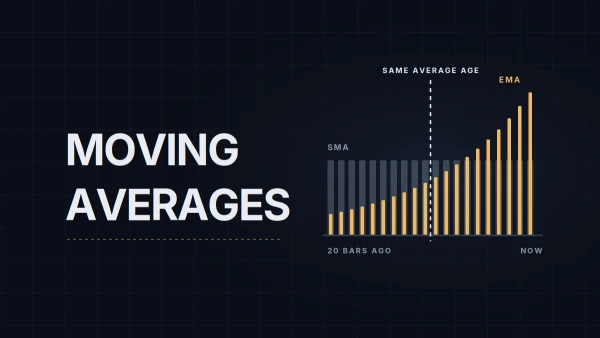
A moving average summarizes recent closes, and the settings traders argue about change less than they think: an EMA(20) is no younger on average than an SMA(20). The arithmetic of SMA, EMA and WMA, where 20, 50 and 200 came from, and the one condition that turns an average into a level.

Education Oct 2, 2026

Trend Day or Range Day: Early Signs on NQ Before 10:30 AM ET

A trend day and a range day reward opposite trades, and the call gets made before 10:30 AM ET. What the overnight range, the open, dealer gamma, the first pullback, first-hour volume, VWAP and the IB's width each say, when each one is known, and what they're worth added together.

Education Sep 28, 2026

Candlestick Patterns That Matter and Those That Don't, With Base Rates

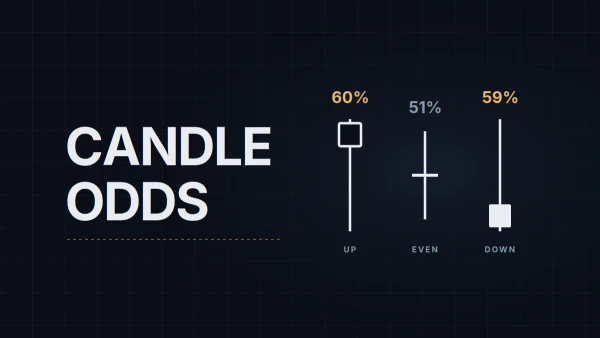
Most famous candlestick patterns land near a coin flip when counted, and the few with big numbers owe part of them to where the pattern closed. Bulkowski's figures read by shape instead of name, the base rate every hit rate needs, and what tests on intraday futures found.

Older posts →